FAQ and Common Issues
Quick diagnosis and resolution for common user-facing problems.
Before you troubleshoot
Check these first:
- Are you logged in with the correct role?
- Is the API reachable at
http://localhost:8000? - Is the dashboard reachable at
http://localhost:3000? - Are required backend services healthy?
Login and access issues
Login fails with unauthorised error
Possible causes: wrong credentials, expired token or session, misconfigured environment values.
- Retry login and verify username and password.
- Log out and log in again to refresh the token.
- Ask an admin to verify your role and account status.
Cannot see pages other users can see
Possible cause: role-based permissions differ. Check Role-Based Access and request the required role from an admin.
Data and refresh issues
Dashboard cards do not update
Possible causes: API call failure, WebSocket disconnected, upstream service lag.
- Refresh the browser once.
- Confirm the API health endpoint responds.
- Confirm the alerts stream is receiving events.
Alerts appear duplicated
Possible cause: source systems sending near-identical events across channels. Check dedup hash fields in alert detail. Group by source and timestamp to verify true duplicates.
Investigation and response issues
Investigation stays pending too long
Possible causes: worker queue backlog, agent endpoint timeout, dependency degradation.
- Check worker and agent service health.
- Retry the investigation once backlog clears.
- Escalate to platform engineer if persistent.
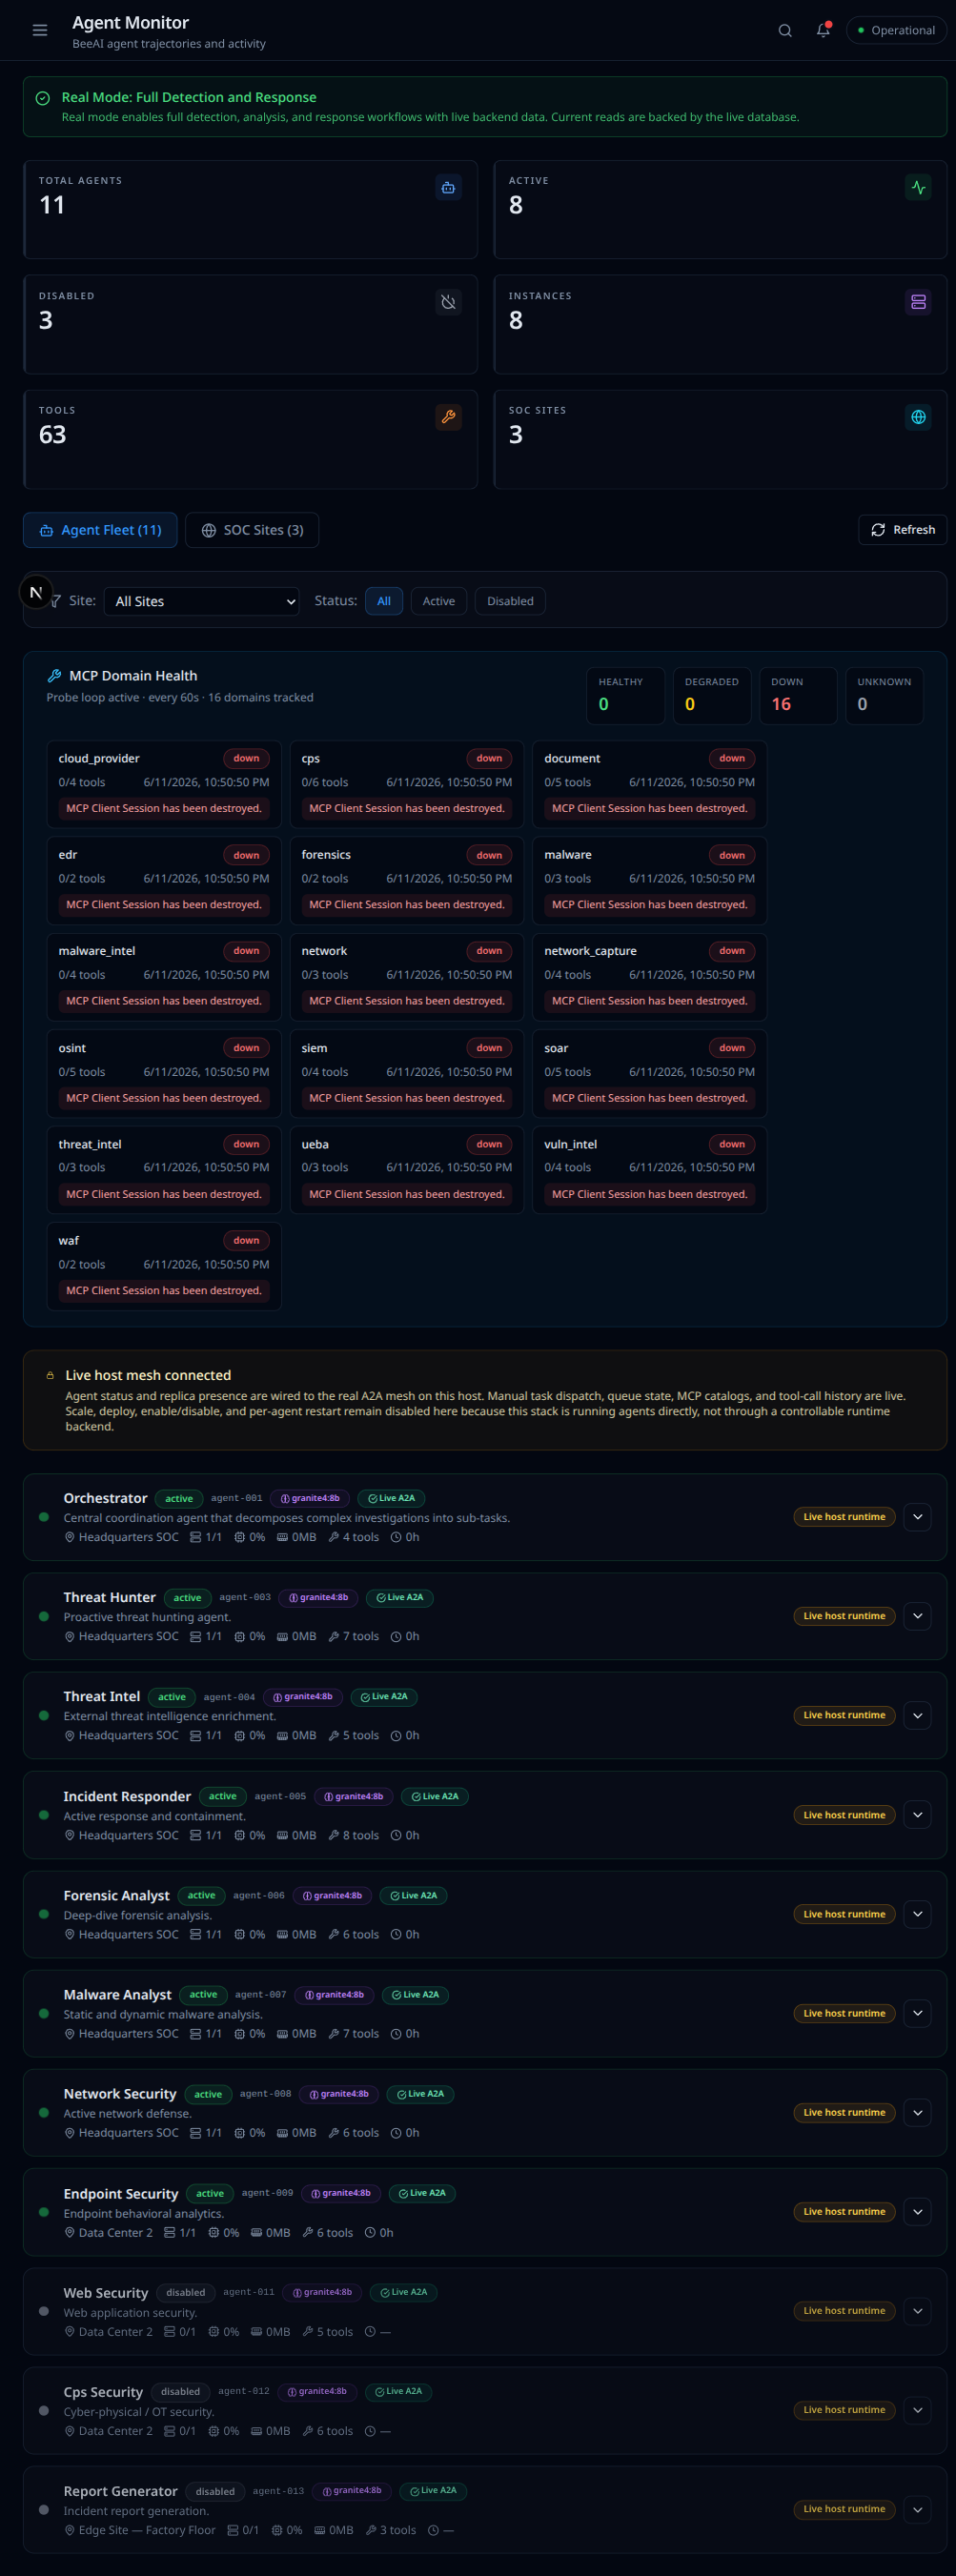
Open the Agent Monitor (Agent Fleet page) to confirm the fleet is up. If the agent and MCP tool servers are not running, every agent shows "Unreachable" and the MCP domains show "down", as below. Investigations will sit pending until those services are back. Start the agent and MCP servers (or their containers), then retry.
Playbook execution blocked
Possible causes: missing permission, approval required, playbook disabled.
- Verify your permissions and role.
- Check the approvals queue and request status.
- Confirm the selected playbook is enabled.
CPS and IoT issues
Device shows untrusted attestation
Open device details, compare firmware version and hash with expected baseline, escalate and isolate if policy requires.
Physical-cyber correlation seems missing
Check the correlation view and time window. Confirm both cyber and physical signals are present for the same period.
Frequently asked questions
Is AuroraSOC safe to use in production as-is?
AuroraSOC includes production-oriented controls. Review deployment hardening guidance before full production rollout.
Can I run only part of the platform?
Yes. Run core API and dashboard flows first, then progressively enable agents and advanced integrations.
Where do I find engineering-level diagnostics?
See the developer documentation sections on monitoring and observability.
Escalation matrix
| Severity | Example Condition | Escalate To | Target Response |
|---|---|---|---|
| Low | UI rendering issue without data impact | SOC operator lead | Same business day |
| Medium | Delayed investigation results | Platform engineer on-call | Within 2 hours |
| High | Playbook execution blocked during active case | Security engineering lead | Within 30 minutes |
| Critical | Widespread auth failures or API outage | Incident commander / SRE | Immediate |
Data to capture before escalation
- Timestamp and timezone of issue occurrence
- User role and affected page or API endpoint
- Request ID or trace ID if available
- Screenshot, error message, and reproduction steps
- Whether the issue is reproducible or intermittent